 Dashboards in Maximizer CRM are great tools to use as they provide you with a detailed view of activities of your choice, making it easy to monitor progress. What’s more, dashboards allow you to see metrics in real time so you can quickly assess which areas require attention. In this blog, we will explain how to use formula fields in Maximizer CRM to format date fields for use on dashboards. This assumes that you already know how to create Maximizer dashboards, catalogue searches and user-defined fields (UDFs). If not, contact us for more information.
There are a few occasions when an actual date doesn’t work well on a dashboard. Some examples:
- Count or sum by year
- Count or sum by month
- Count or sum by quarter
To create these types of dashboards, we may need to create formula fields that format the date value into something more useful for a dashboard indicator to use.
When creating these formula fields it is important to remember how Maximizer will sort data in a dashboard. Numeric formula fields will sort numerically, and alphanumeric formula fields will sort alphabetically.
So a numeric field with values 1 to 12 would sort 1, 2, 3, 4, 5, 6, 7, 8, 9, 10, 11, 12 whereas an alphanumeric field would sort 1, 10, 11, 12, 2, 3, 4, 5, 6, 7, 8, 9. To get the alphanumeric field to sort correctly we would need to add a leading 0 for 1 to 9, so you get 01, 02, 03, 04, 05, 06, 07, 08, 09, 10, 11, 12.
For these examples, I have created an opportunity date user-defined field called ADateUDF as the source date. However, any date field or date user-defined field could be used as the source date.
In these examples, all of the dashboard indicator screenshots use the same opportunity search and display the data as bar charts which count records that are grouped and sorted by the formula field. The bar chart settings are set to turn off both 3D and grid lines.
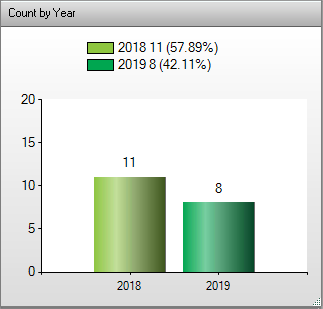
Dashboard Indicator: Count opportunities by year.
Numeric Formula: year([ADateUDF])
Dashboard Indicator: Count opportunities by month
Numeric Formula: month([ADateUDF])
Note: this dataset has multiple years of data and the grouping is just by month. This may not always be desirable as multiple years for the same month will be combined.
Dashboard Indicator: Count opportunities by year and month
Alphanumeric Formula: mid(text(year([ADateUDF])),3,2) + “_” + if(month([ADateUDF]) < 10, “0” + text(month([ADateUDF])), text(month([ADateUDF])))
Note: this formats the year and month as a two digit year and a two digit month in the format YY_MM. If the month number is less than 10 the month is prefixed with 0.
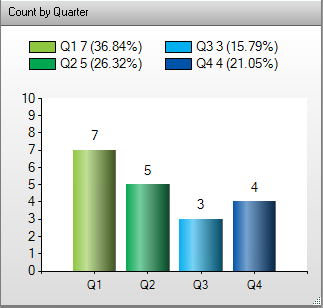
Dashboard Indicator: Count opportunities by Calendar Quarter
Alphanumeric Formula: “Q” + text(floor((month( [ADateUDF] ) – 1) / 3) + 1)
Note: this prefixes the quarter with Q. Again, this dataset has multiple years of data and grouping is just by quarter. This may not always be desirable as multiple years for the same quarter will be combined.
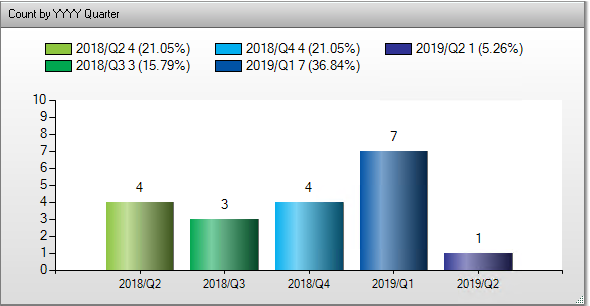
Dashboard Indicator: Count opportunities by Calendar Quarter
Alphanumeric Formula: text(year( [ADateUDF] )) + “/Q” + text(floor((month( [ADateUDF] ) – 1) / 3) + 1)
Note: this prefixes the quarter with the four digit year. This could be shortened to be a two digit year like the previous example for year and month.
Further reading on the syntax for formula fields can be found in the “Writing Formulas and Mandatory Rules” in the Maximizer Administrator manual. Alternatively, contact us to find out how you can make the most out of Maximizer CRM dashboards… we’d be happy to help you learn more about formula fields in Maximizer CRM!


